







 RY
Filter
Position in Year Range Filter (RY)
Find stocks trading near their 52-week high, or near their 52-week low, in real time, with Trade Ideas Streaming Alerts (Scanner) and Top Lists (Screeners). The Position in Range (1 year) filter shows where the current price sits in the stock's 52-week high-low range, as a percent: 0 is the low, 100 is the high, and above 100 means a new high.
See the breakout when it prints, not after.
Free account, just an email. No card. Live access for a limited time.

Streaming Alerts check the Position in Range (1 year) filter the moment each alert fires, and Top Lists can sort by it.
How Trade Ideas finds it: set the minimum value to 25 to see stocks which are at least 25% above the low of its year range. See Trade Ideas plans and pricing to run it live.
How the Position in Range (1 year) filter works
The "position in year range" filter is used to evaluate where the current price of a stock stands relative to its price range over the past 12 months. This filter helps traders assess the recent price movement of a stock and identify potential trading opportunities based on its position within this range.
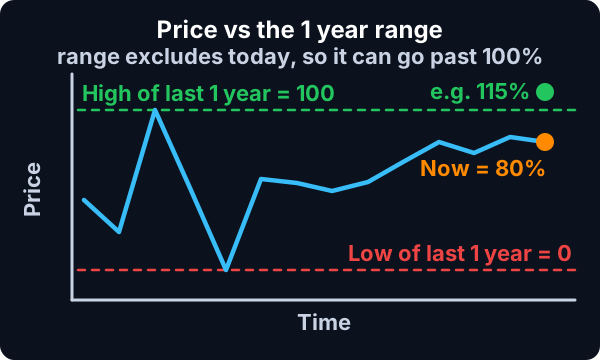
Here's how the "position in year range" filter works:
Calculation of Year Range: The filter calculates the price range of the stock over the past 12 months. This range typically spans from the lowest price (low) to the highest price (high) traded during this period.
Formula
Position Calculation: Next, the filter determines the position of the current price within the 12 month range. This calculation is expressed as a percentage, indicating how far the current price is from the lowest or highest price of the past 12 months.
This uses the same scale as the other position in range filters. 0% means that the stock is currently trading at the lowest price that it has traded in the previous 12 months. 100% means that the stock is trading at the highest price of that time frame.
Formula
This filter is similar to the Position in Previous Day’s range filter, because it does not look at today’s data when they calculate the range. If the current stock price is $10, and the highest price in the previous 12 months was $9, then the value of this filter will be above 100%. If the current price is less than the lowest price of the last 12 months, then this filter will have a negative value.
The current price is based on the last print. There is no smoothing or averaging. These filters update before, during, and after market hours.
The column for this scan will be displayed as a graphical indicator. To view the percentage, simply right-click on the column and deselect the option labeled "Graphical Indicator."
If you opt to utilize the graphical indicator, here's a brief overview of the various types of graphics and their corresponding meanings:

=


=


=

Position in Range (1 year) filter settings
Settings
The settings of each Trade Ideas filter are defined in the Window Specific Filters Tab located in the Configuration Window of your Alert or Top List (Screener) window.
Here is how to setup the filter in your configuration window:
- Set the minimum value to 25 to see stocks which are at least 25% above the low of its year range.

Using the Position in Range (1 year) Filter
Several trading strategies can be employed with the Position in Range (1 year) filter. Here are a few examples:
- Trend Confirmation: Traders assess the position of the current price within the yearly range to confirm existing trends. If the price consistently stays near the high or low of the range during an uptrend or downtrend, respectively, it suggests that the trend is still intact. Traders may consider entering positions in alignment with the trend.
- Reversal Trading: Contrarian traders look for stocks that have moved significantly away from the high or low of the yearly range, indicating potential overbought or oversold conditions. Reversal signals near the range's extremities, such as bearish or bullish candlestick patterns, may prompt traders to anticipate a reversal back towards the mean.
- Range Trading: Traders identify stocks trading within the yearly range and aim to capitalize on price oscillations within this range. They may initiate long positions near the range's low and short positions near the high, intending to profit from price reversals back towards the range's midpoint.
Filters to combine with Position in Range (1 year)
Alerts to pair with the Position in Range (1 year) filter
FAQ
Which stocks are trading near their 52-week high right now?
Add the Position in Range (1 year) filter (RY) to a Trade Ideas Streaming Alerts or Top List (Screener) window. Set the minimum value to 25 to see stocks which are at least 25% above the low of its year range.
What is the Position in Range (1 year) filter?
The Position in Range (1 year) filter shows where the current price sits in the stock's 52-week high-low range, as a percent: 0 is the low, 100 is the high, and above 100 means a new high.
How do I find stocks near 52-week lows?
Use the Position in Range (1 year) filter (RY) in Trade Ideas Streaming Alerts and Top Lists to find stocks trading near their 52-week high, or near their 52-week low. The Position in Range (1 year) filter shows where the current price sits in the stock's 52-week high-low range, as a percent: 0 is the low, 100 is the high, and above 100 means a new high.