







 GDBOT
▲ Bullish
Streaming Alert (Scanner)
Double Bottom Alert (GDBOT)
By Daniel Mirkin, CEO, Trade Ideas. Updated October 2026.
Find stocks forming a double bottom pattern in real time with Trade Ideas Streaming Alerts (Scanner). A double bottom pattern is when a stock has made two or more lows at about the same price, with significant time and volume between them.
Know when the pattern finishes.
Free account, just an email. No card. Live access for a limited time.


Streaming Alerts show a double bottom the moment it completes, not on the next refresh.
How Trade Ideas finds it: by default, the 'Double Bottom' alert will appear when there are two lows at approximately the same price, with significant time and volume between them. See Trade Ideas plans and pricing to run it live.
What is a double bottom?
A double bottom is a chart pattern where a stock falls to a price, bounces, falls back to about the same price, and then rises again. On a chart it looks like the letter W. Traders watch it because the second low shows that sellers tried twice to push the stock lower and ran out of steam at the same place.
Trader tip
The pattern is not finished at the second low. Most traders wait until price moves back above the high between the two lows, called the neckline, before they treat it as a double bottom.
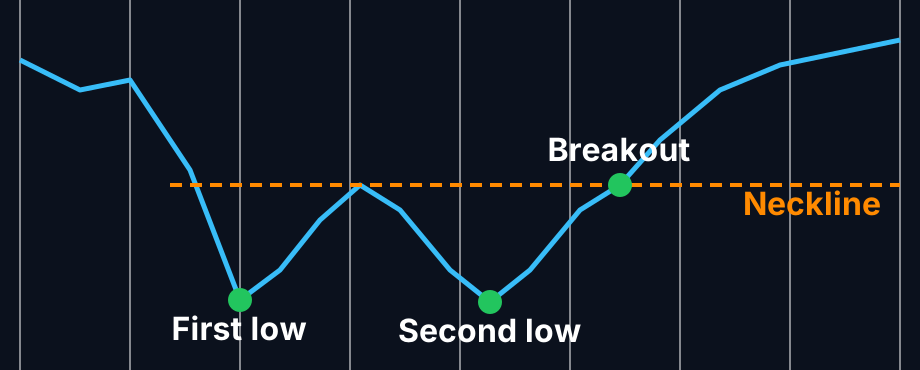
Parts of a double bottom
First low
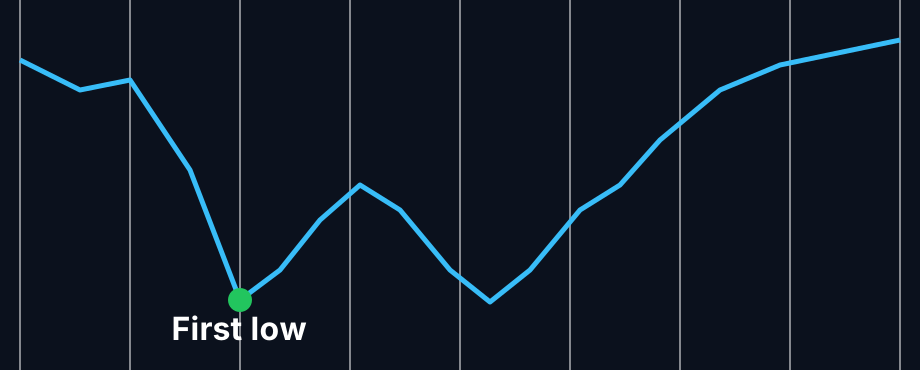
The stock sells off and finds a floor. Nothing about the first low tells you a pattern is forming yet. It is just a low.
Neckline
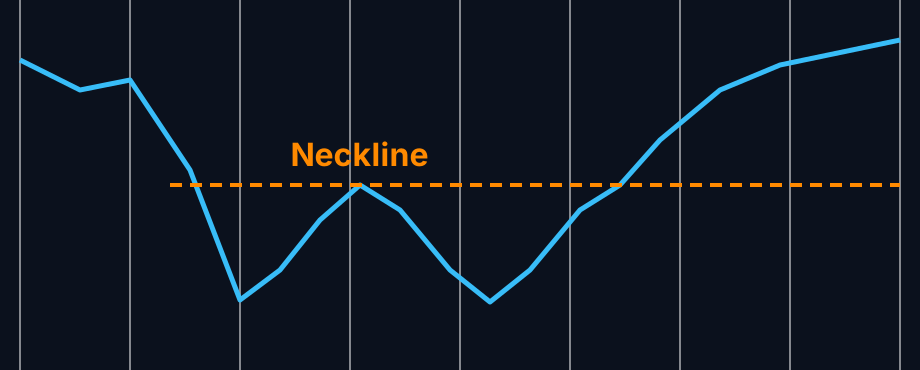
After the first low the stock bounces. The high of that bounce is the neckline. It is the line price has to get back above for the pattern to count.
Second low
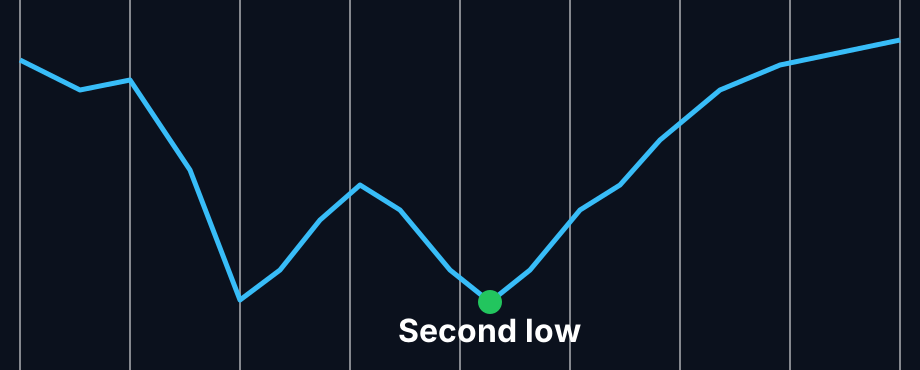
The stock pulls back and stops at about the same price as the first low. Trade Ideas wants real time and volume between the two lows so they are two separate tests, not one messy bottom.
Breakout
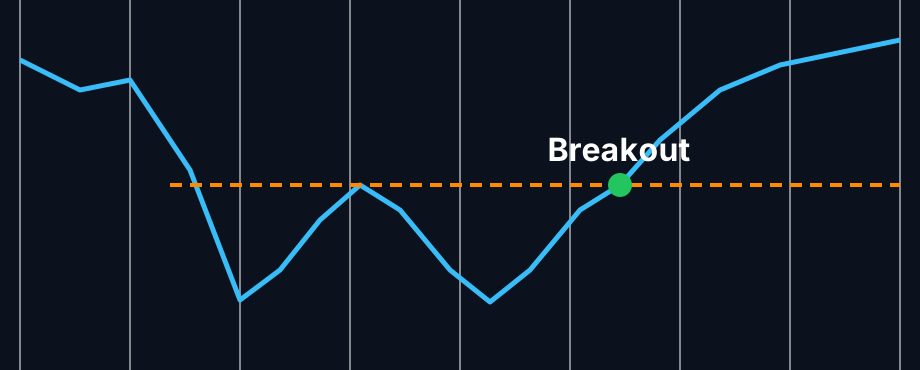
Price rises back through the neckline. This is where the pattern is complete. Many traders want to see volume pick up here.
How traders use it
Step 1: Let the Trade Ideas alert find it
Key point
Turn on the Double Bottom alert (GDBOT) in Streaming Alerts. The servers look for two lows at about the same price, with enough time and volume between them, across the whole market. You do not have to draw anything. Add filters such as price, volume, or relative volume to narrow the list to stocks you would actually trade. See it live in the Web Dashboard.
Step 2: Wait for the trigger
A second low by itself is not a trade for most people. Traders typically wait for price to move back above the neckline, and many want that move to come on higher volume than usual.
Step 3: Entry
Trader tip
Some traders buy as price clears the neckline. Others wait for a pullback that holds the old neckline as support. The second way gives up some of the move in exchange for more confirmation.
Step 4: Exit
A common approach is a stop just under the second low, or under the neckline for a tighter stop. For a first target, many traders measure the distance from the lows up to the neckline and add it to the breakout price. That is how traders typically handle it, not advice, and the pattern fails often enough that a plan for being wrong matters.
Tips
- Check the volume. A breakout on light volume fails more often.
- Look at the bigger picture. A double bottom in a stock that is falling hard on the daily chart is a weaker setup than one near support.
- The alert-specific filter is measured in hours of trading, weighted by volume. A higher number asks for a pattern that took longer to form, so you get fewer alerts.
- The Double Top alert (GDTOP) finds the same pattern upside down.
Past results, including backtests, are not indicative of future results.
How the Double Bottom alert works
A double bottom is a common long-term technical analysis pattern. A double bottom is defined by at least two lows at approximately the same price level. Significant time and volume must exist between the two lows, making them distinct.
Key point
This alert can also report triple bottoms, quadruple bottoms, etc. In these cases, the alert description states the number of lows. We do not require as much time or volume between the individual lows in a triple or quadruple bottom as we do in a double bottom, as long as the first and last low are spread sufficiently far apart.
Default settings
By default, the 'Double Bottom' alert will appear when there are two lows at approximately the same price, with significant time and volume between them.
Custom settings
Settings
For 'Double Bottom' alerts, you have the option to use an alert specific filter. This filter is located immediately to the right of the corresponding alert and is always optional. You can decide to leave it blank if you want to receive more alerts, or you can fill it in to restrict the number of alerts you receive. This filter allows you to specify the quality of the alert. When you set a higher number for this filter, you are telling the alerts server to display only alerts that meet a higher quality standard, resulting in fewer alerts being shown.
When setting an alert for 'Double Bottom', the user can filter the alert by hours traded.

Key point
If I see a pattern that lasted from noon yesterday to noon today, is that any better than a pattern that lasted from the open this morning to the close this afternoon? How much better? We weight the pre and post market according to volume. On an average day an average NASDAQ 100 stock will trade roughly 1 hour's worth of volume between the close and the following open. If you want to see stock patterns that lasted for a whole day, a good estimate is 7.5 hours, 6.5 for normal hours plus 1 for the pre and post market.
The same rules apply during the day. If a chart pattern lasts for one hour starting from the open, it will almost always be considered a stronger pattern than if it lasted one hour starting from the beginning of lunch. Hours are just an estimate. Volume is the major factor in this filter. Stocks trading on higher than average volume will satisfy this filter faster than stocks trading on lower than average volume.
What the alert shows you
Key point
The description of each alert lists the prices that formed the pattern. It also includes the times of when the pattern started and ended.

The quality value on a scan using the 'Double Bottom' alert defines the number of hours since the measured pattern has been established.

Related alerts
Filters to pair with the Double Bottom alert
Categories
FAQ
Which stocks are forming a double bottom pattern right now?
Turn on the Double Bottom alert (GDBOT) in Trade Ideas Streaming Alerts. By default, the 'Double Bottom' alert will appear when there are two lows at approximately the same price, with significant time and volume between them.
What is the Double Bottom alert?
A double bottom pattern is when a stock has made two or more lows at about the same price, with significant time and volume between them.
How do I see fewer, higher-quality Double Bottom alerts?
Use the optional alert-specific filter immediately to the right of the alert. A higher number tells the alerts server to show only higher-quality alerts, so fewer appear. Leave it blank to see more.
What is the opposite of the Double Bottom alert?
Is a double bottom bullish or bearish?
A double bottom is usually read as bullish. It shows sellers pushed the stock down to the same price twice and could not take it lower. The pattern is not confirmed until price closes above the neckline.
How far apart should the two lows be?
There is no fixed rule. The Trade Ideas Double Bottom alert requires significant time and volume between the two lows so they are two separate tests of the price, not one choppy low.
Do the two lows have to be the exact same price?
No. They need to be about the same price. Small differences are normal.
Does the alert find triple bottoms too?
Yes. If a stock makes three or more lows at about the same price, the alert reports it and the description says how many lows there were.